

 Air Pollution and Your Health: Understanding PM₂.₅
Air pollution affects everyone's health and well-being, but some communities experience higher levels of pollution than others, even within the same city. One of the most concerning pollutants is fine particulate matter, known as PM₂.₅.
What is PM₂.₅?
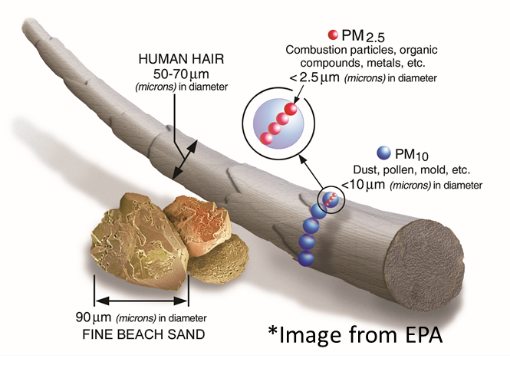
PM₂.₅ consists of tiny solid particles and liquid droplets in the air, measuring ₂.₅ micrometers or smaller—about 30 times smaller than the width of a human hair. Because they're so small, PM₂.₅ particles can travel deep into your lungs and even enter your bloodstream.
Why Should You Care?
Breathing in PM₂.₅ has been linked to serious health problems, such as:
- Aggravated asthma
- Reduced lung function
- Irritation of the respiratory system
- Nonfatal heart attacks
People with heart or lung conditions, children, and older adults are especially at risk and should limit their exposure to PM₂.₅ whenever possible. There is also a developing body of evidence that PM₂.₅ can cause other health problems related to maternal and fetal outcomes, as well as brain function.
Where Does PM₂.₅ Come From?
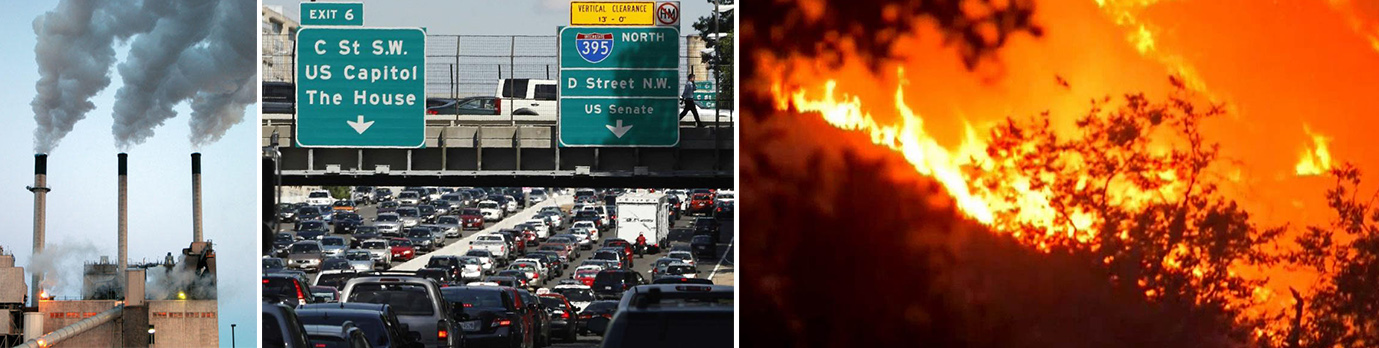
Major sources include:
- Vehicle emissions
- Industrial activities
- Wildfires
- Construction sites
 How is PM₂.₅ Regulated?
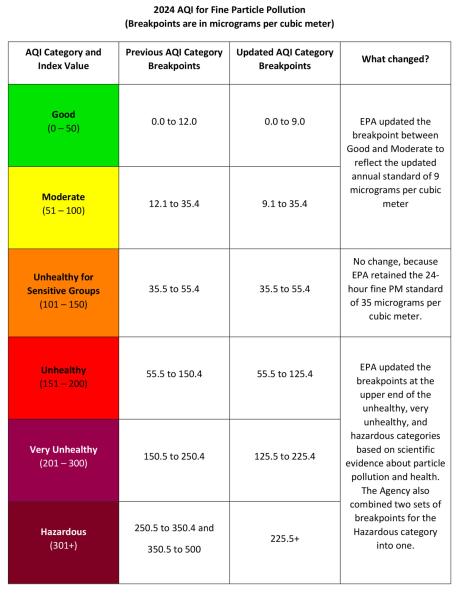
The Environmental Protection Agency (EPA) sets national standards to protect our health. Recently, in May 2024, the EPA strengthened the annual PM₂.₅ standard from 12 µg/m³ (micrograms per cubic meter) to 9 µg/m³, aiming to offer even better health protection. In the District, we are currently meeting the stricter standards of 9 µg/m³ and will continue to monitor air quality to keep our communities safe.
Monitoring PM₂.₅ in the District
We track PM₂.₅ levels at five monitoring sites across the District:
- River Terrace Education Center (By Benning Road)
- Near Road (By Benning Road and I-295)
- McMillan Reservoir (By Howard University)
- King Greenleaf Recreation Center (Buzzard Point)
- Bald Eagle Recreation Center (In Southern Ward 8)
Explore the Data
The PM₂.₅ data below lets you select any one of these monitors and compare hourly and daily readings to see how the air quality changes across different areas of the District.
If you have questions or would like further explanations of the data, please contact Kane Samuel at [email protected].